




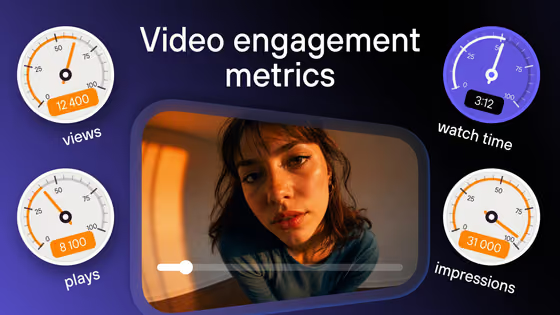

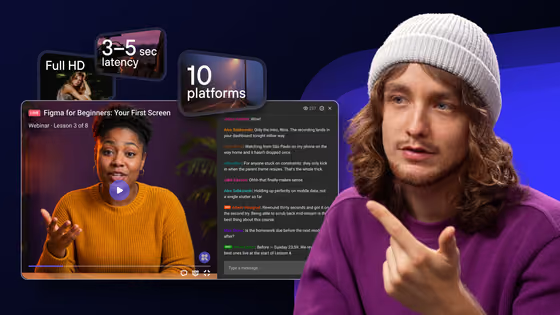



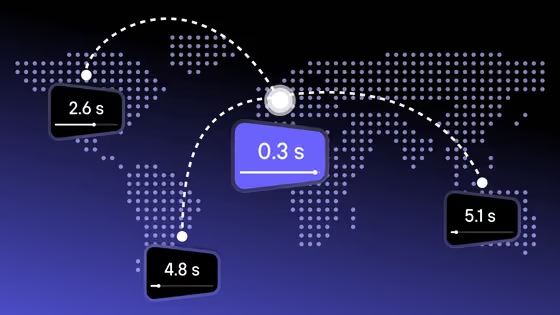











Video analytics that turns views into insights

Track engagement, popularity, and viewing patterns to make data-driven content decisions.
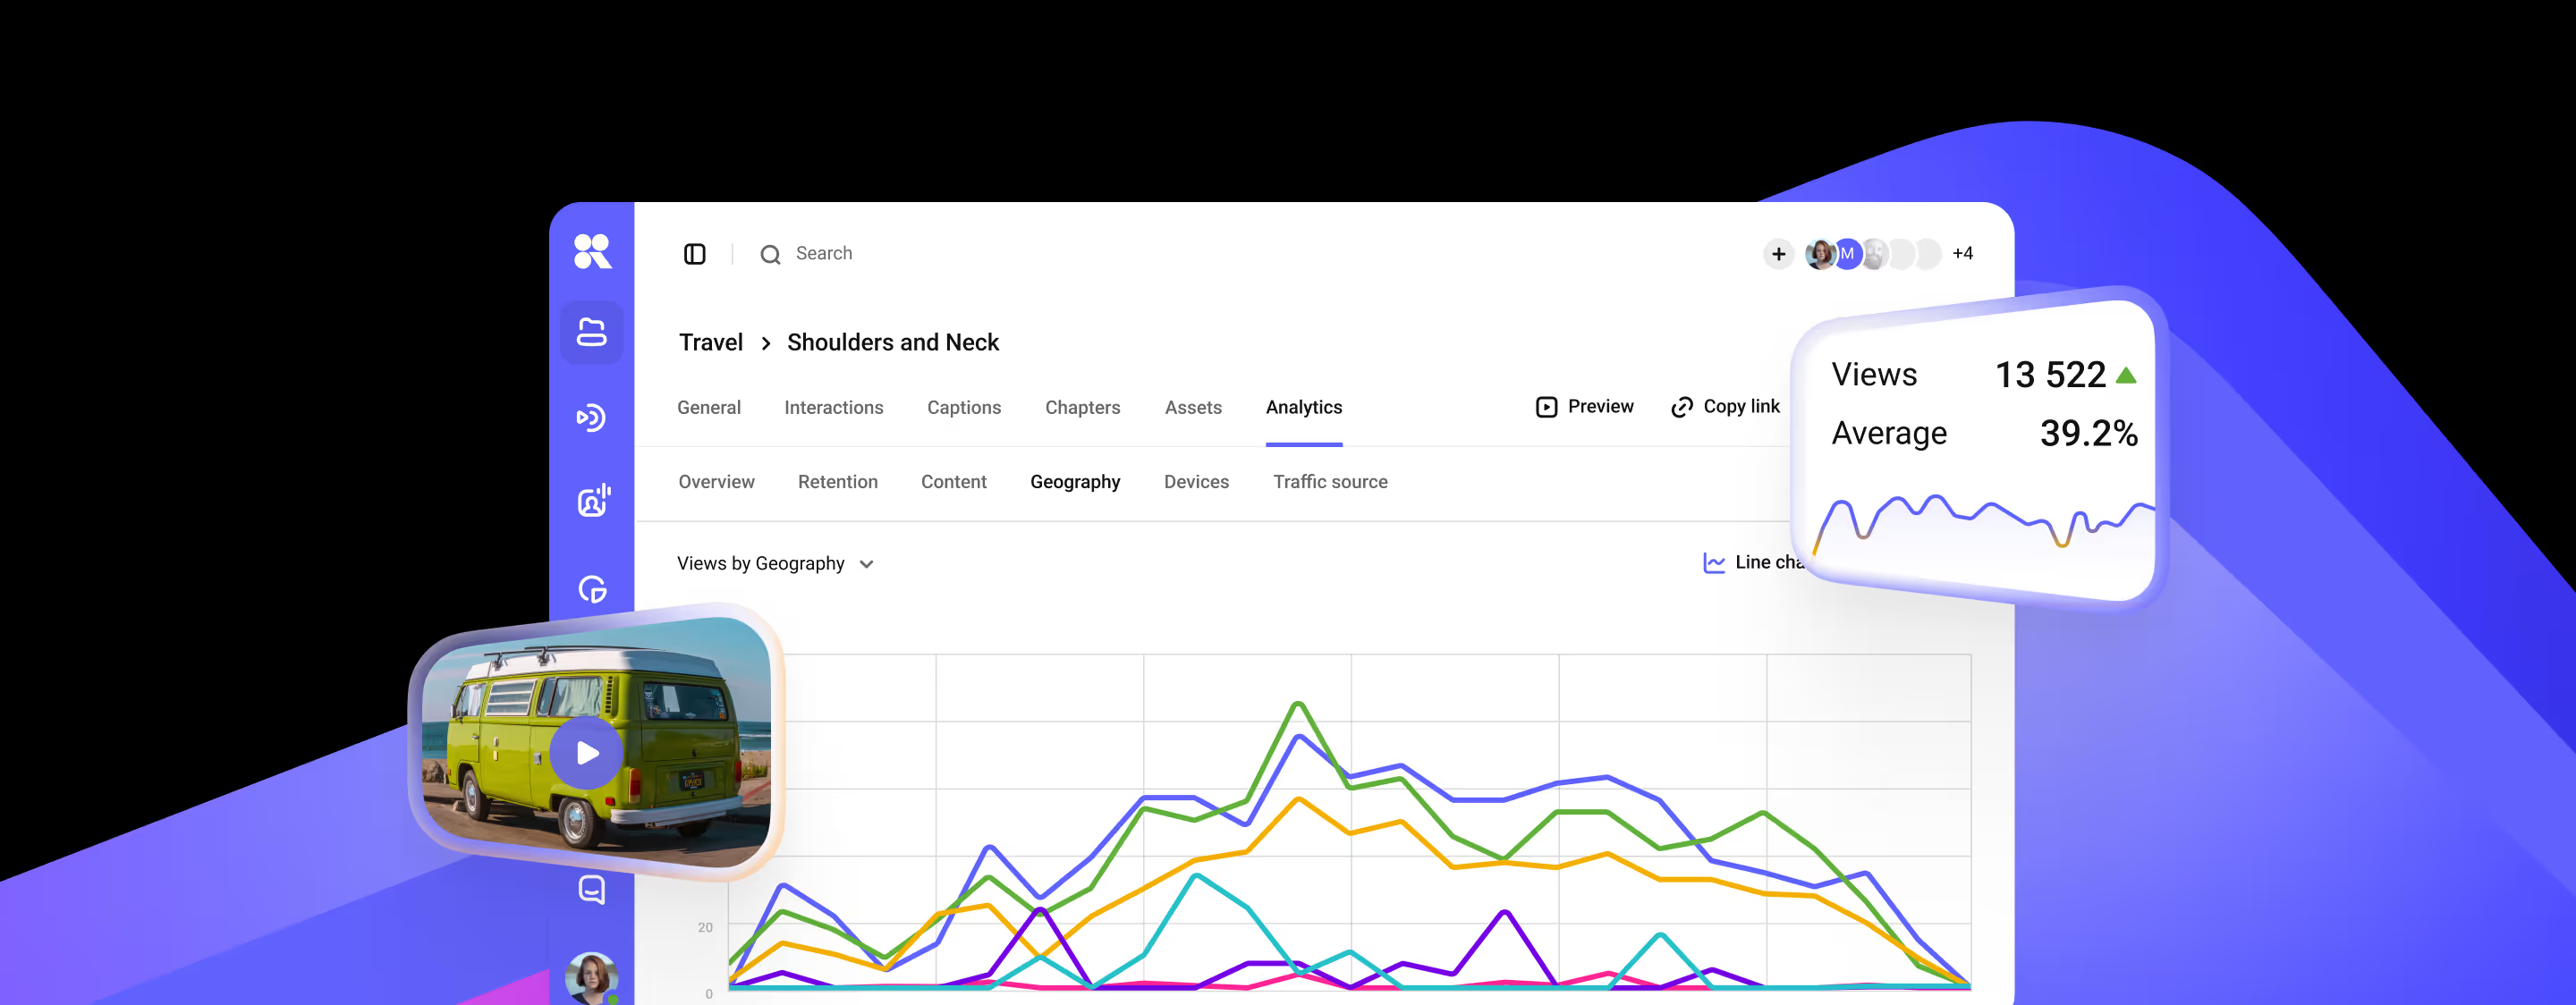
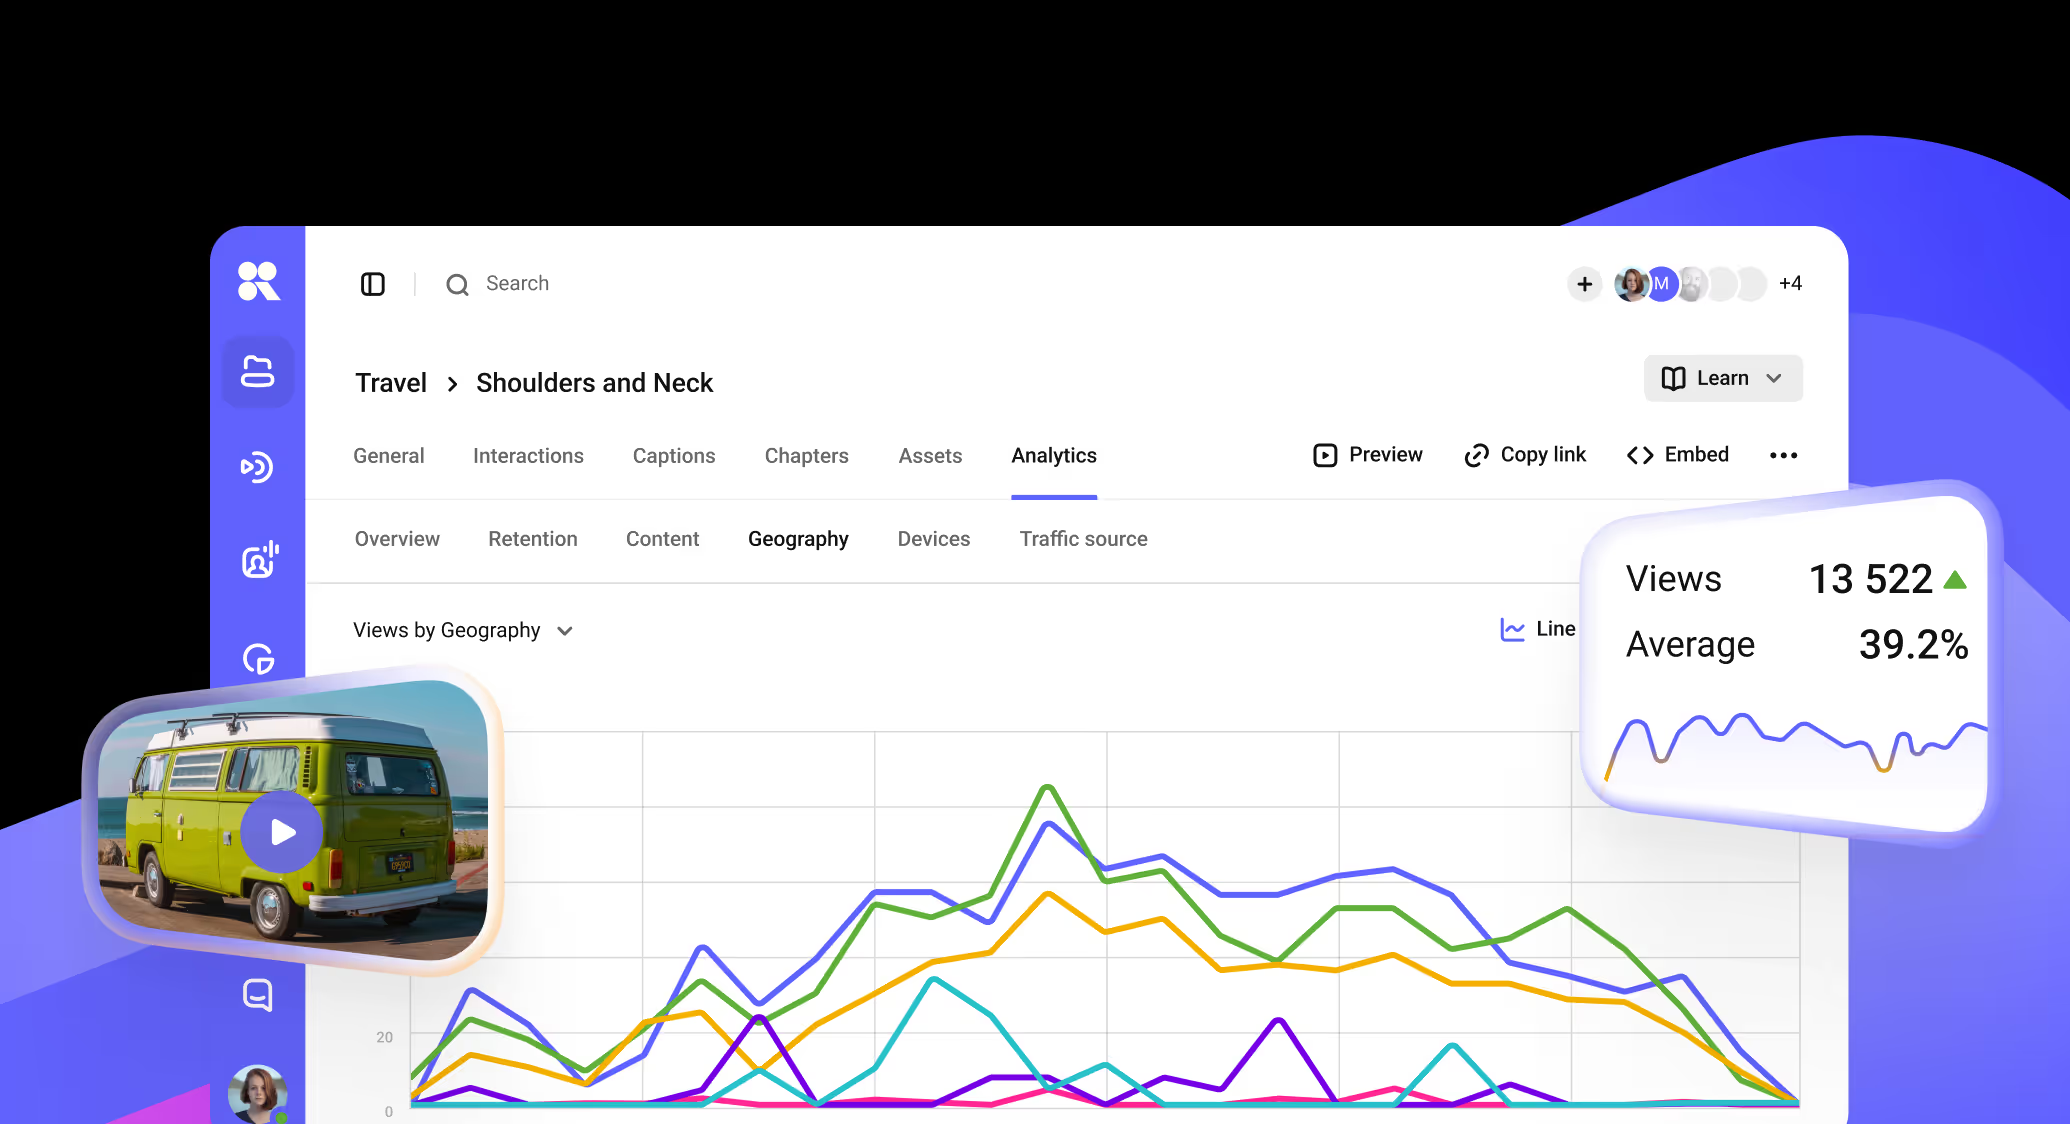
Advanced engagement analytics
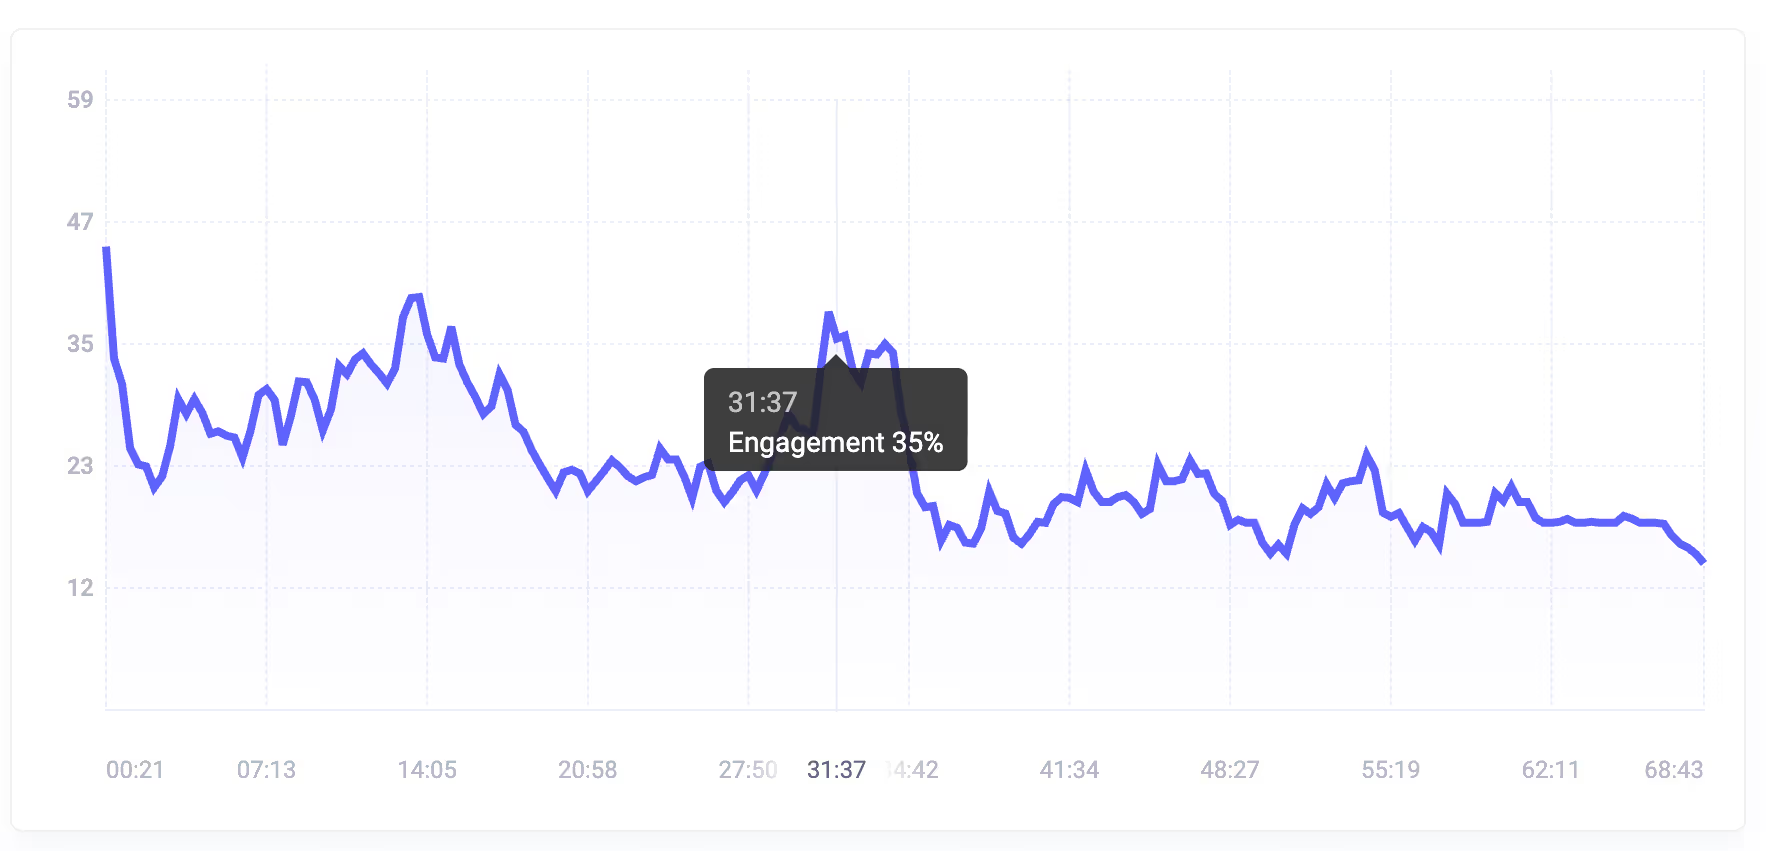


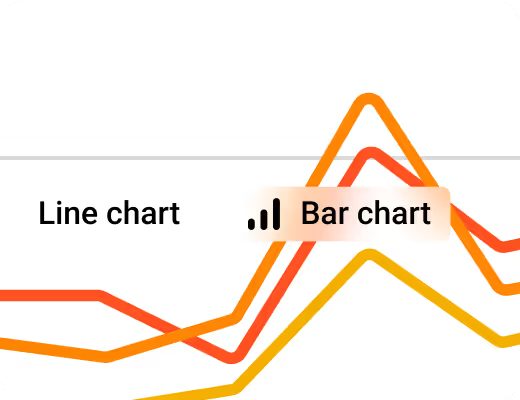
Engagement graph
Track what captures attention, where viewers drop off, and what they revisit.
Unified analytics
Link view data to user IDs to track behavior across all stages.
Devices & geographics
See viewer locations, device types, and browser preferences.
Analytics via API
Easy collection
Send viewers' IDs and receive consolidated data based on objectives.
Direct delivery
All data is available via API. Player events can also be streamed directly.
FAQ
Can’t find the answer you need? Check out our Help Center.
Yes. Loads, views, completion rate and engagement graphs are available on the free plan — analytics is not gated behind a paid tier.
Loads and views, watch-through and completion rate, the points where attention drops, unique versus repeat viewers, plus device and geography breakdowns.
Yes. All metrics are available through the API, and the player emits events you can forward to your own analytics stack.
No. Protected videos report exactly the same metrics as unprotected ones — retention, drop-off points, viewer counts and geography all behave identically.
Kinescope includes full analytics in the free plan
Free to start, then from €10/month. Sign up to see how your audience watches.