


















Video Engagement Analytics: What to Measure and When




Understand your video audience
Video analytics begins with actions a player can record: someone starts playback, watches a passage, skips ahead or returns to it. To understand whether that viewing helped someone buy, learn or solve a problem, you need to follow what happened next. A purchase, a completed exercise or a resolved support issue may be recorded in a customer relationship management system (CRM), learning platform or support system. Connecting those outcomes to viewing data helps you assess the video’s role in that process.
This guide explains the main metrics, shows how the analysis changes for sales, learning, marketing and support, and outlines how to connect viewing records to a CRM.
Key takeaways
- A player can load without anyone watching, and one person can watch several times, so loads and views cannot be treated as counts of people.
- A dip on a viewing curve identifies a section to investigate; records of individual viewing sessions help distinguish skipping from leaving.
- Most viewers may reach an offer in the video even when few page visitors start watching. Check both video starts and viewing of the offer before deciding what to improve.
- Linking playback history to a CRM contact helps sales choose what to clarify in the next conversation.
Which video engagement metrics to track
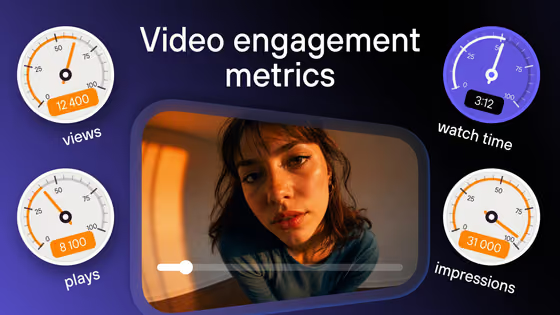
Video engagement metrics describe how often people watch, which parts they reach and what they return to. Start with the question you need to answer about the video, then choose the measure that can answer it.
| Metric | What it measures | When it helps |
|---|---|---|
| Views | Playback that meets the platform’s counting rule | Tracking viewing volume |
| Average watch time | Viewing duration averaged across the views or viewing sessions counted by the platform | Comparing overall viewing duration |
| Retention | How many views each moment of the video receives | Locating changes along the timeline |
| Drop-off | A fall in viewing between two points in the video | Finding a section to investigate for exits or skips |
| Repeat viewing | A video or section played again, under the platform’s repeat-counting rules | Finding material people revisit |
| Completion rate | The share meeting a defined completion rule, such as an endpoint or watched-coverage threshold | Checking required coverage or arrival at the ending |
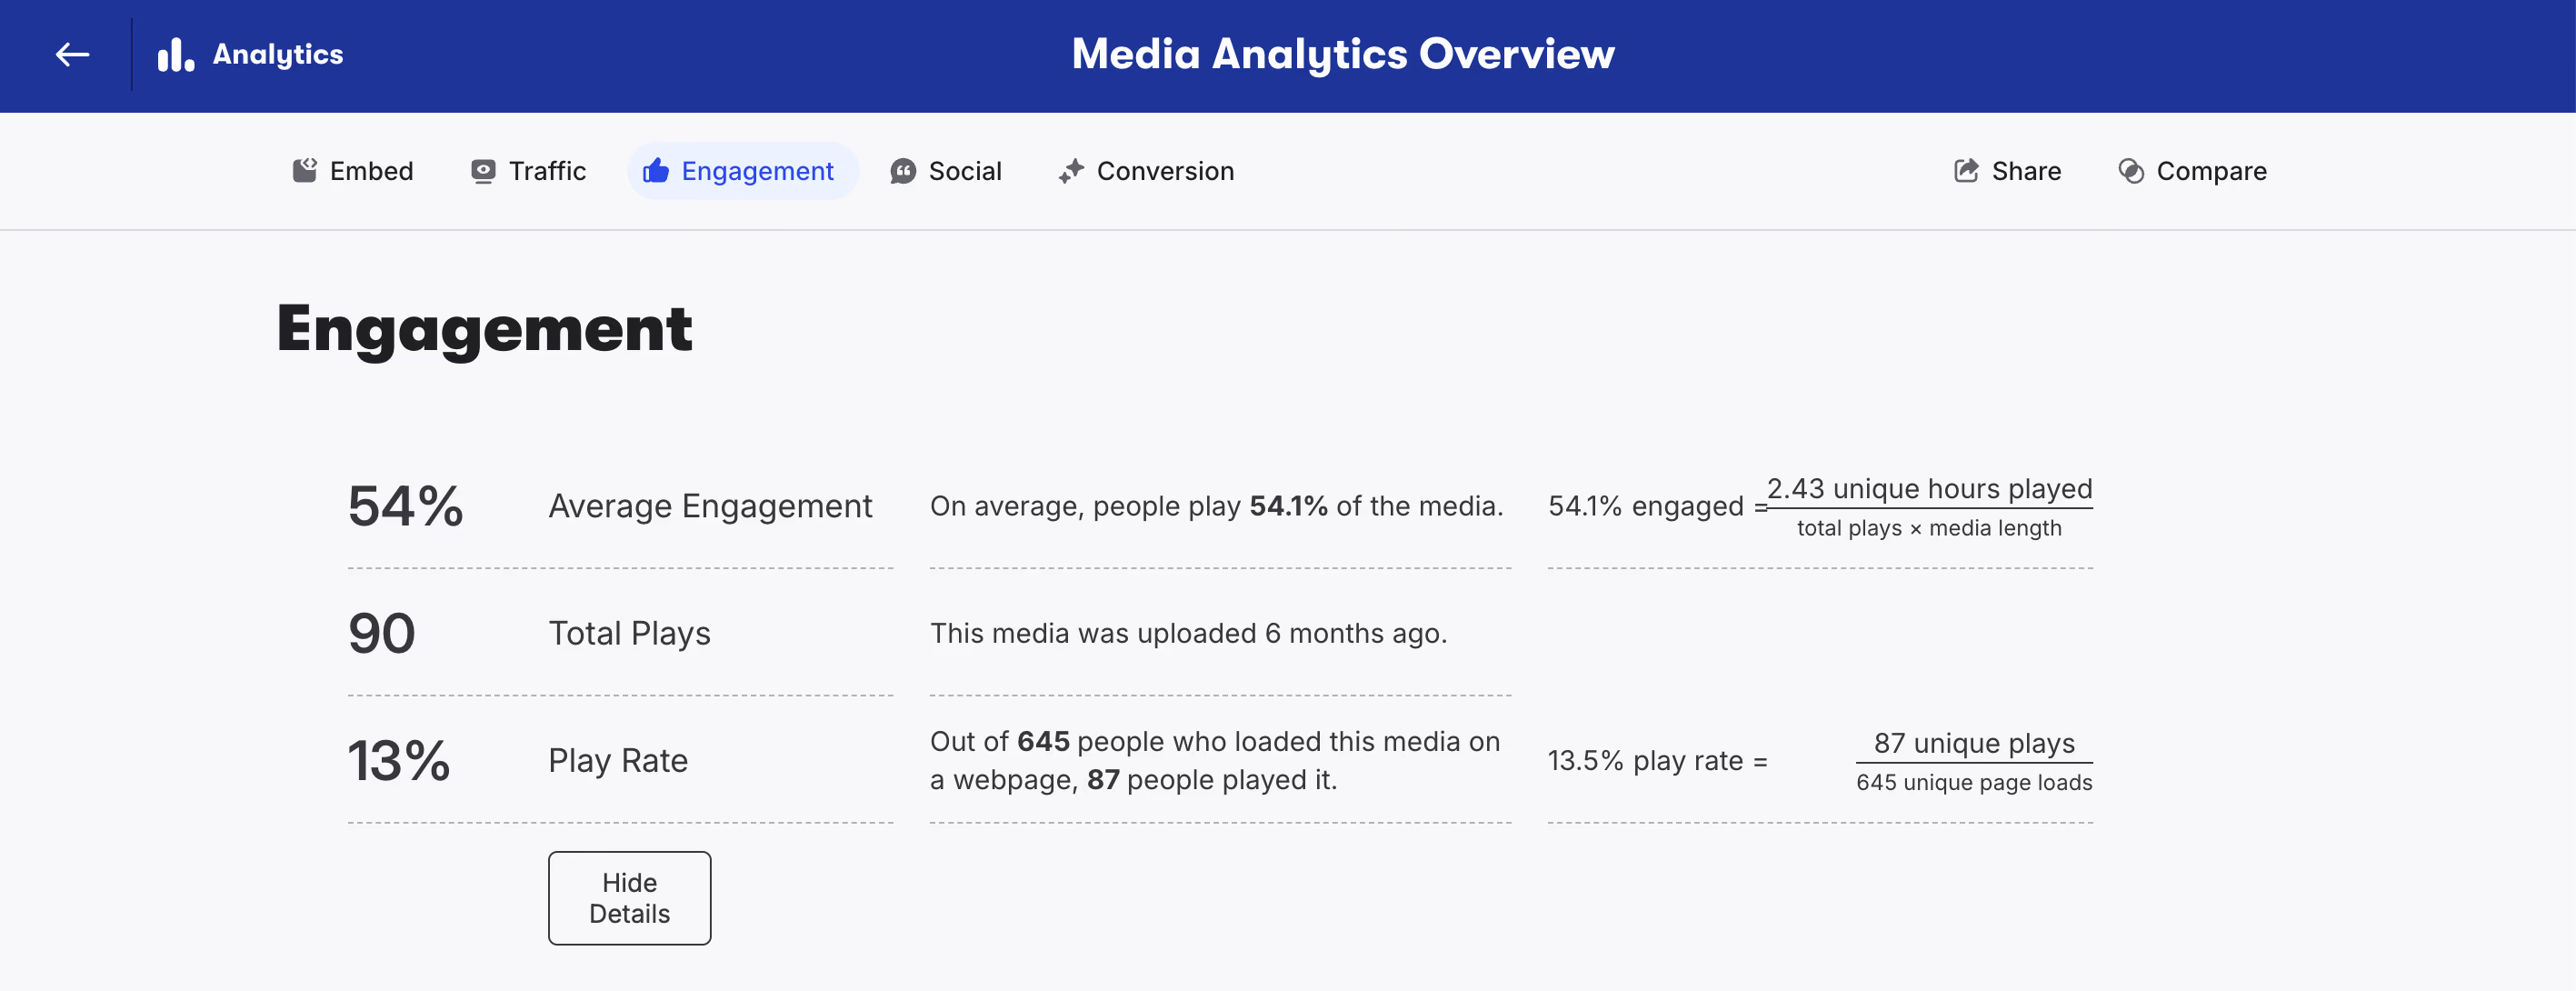
Before using completion rate, check how the video platform defines a completed view. Vimeo’s glossary distinguishes finishes, which count viewing of the last two seconds, from completions in team reports, which require more than 95% watched within one session. A finish count therefore cannot establish whether earlier sections of the video were played.
Each of these metrics can also be examined for a particular audience group, such as new customers or visitors from a campaign. Comparing groups shows how engagement varies across audiences and helps you tailor the video to the people it is intended to reach.
Player loads, views and viewers: what’s the difference?
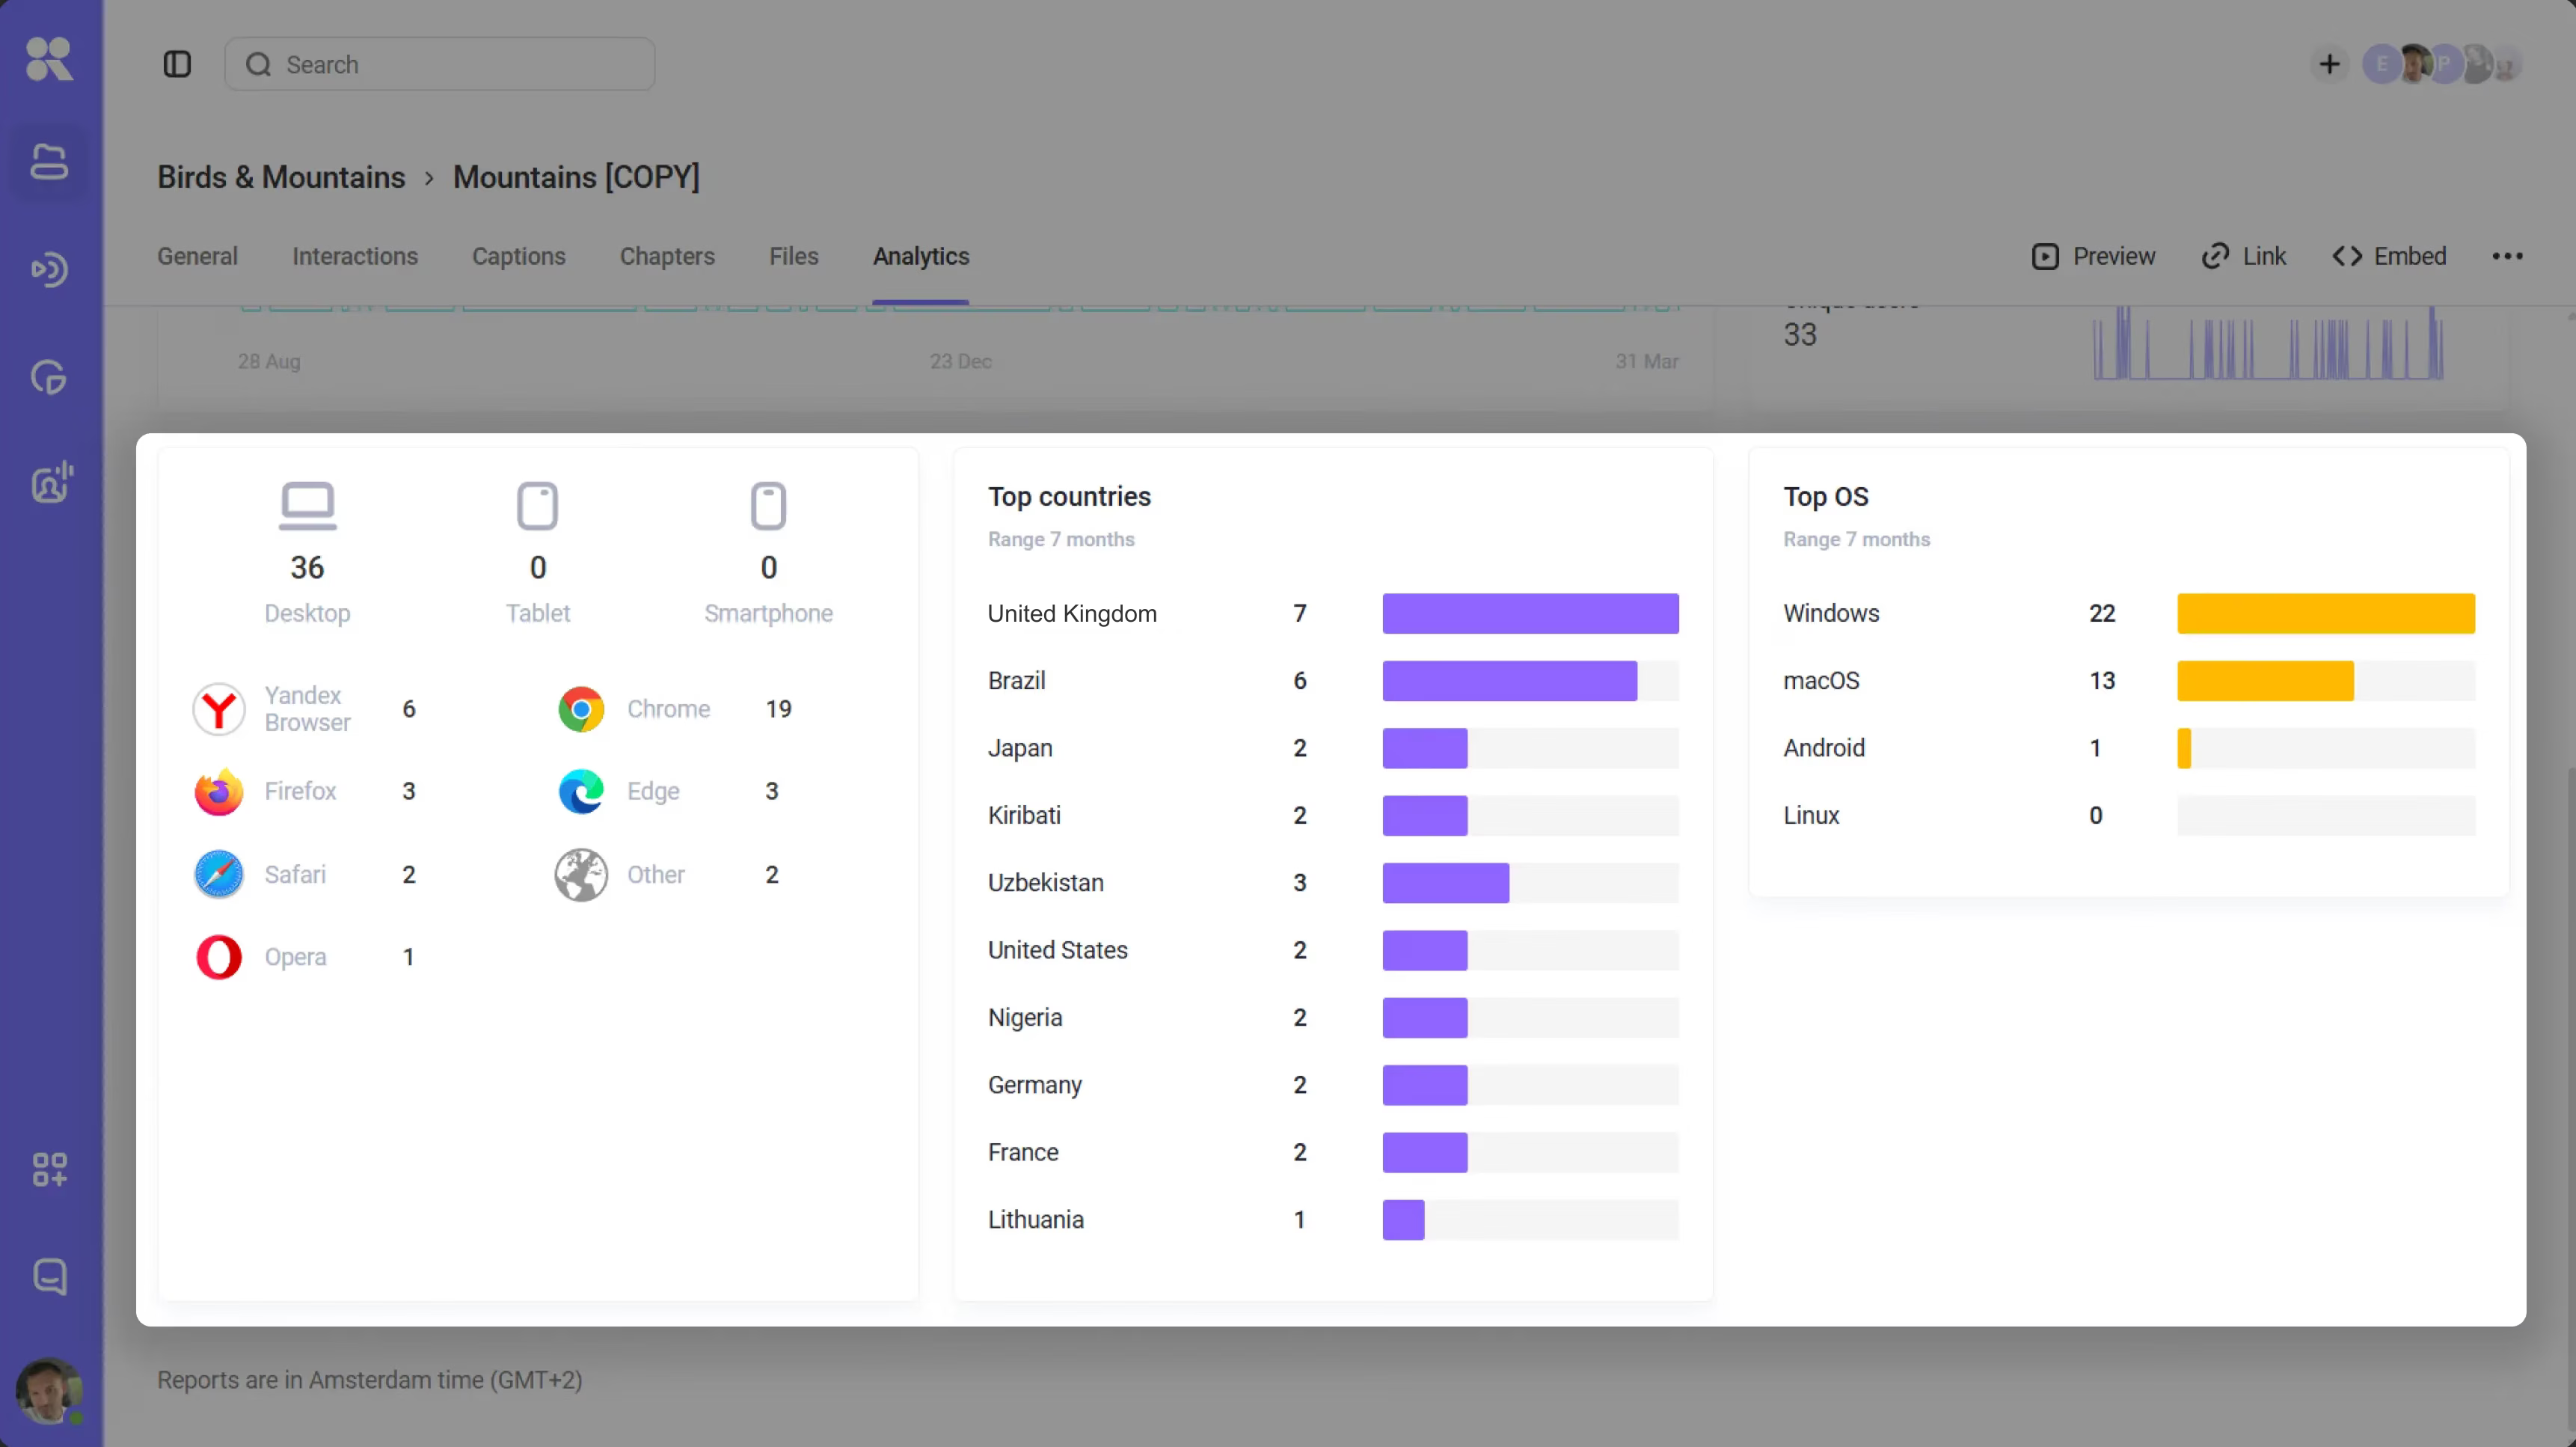
An embedded player can load before anyone starts the video, so a player load does not necessarily produce a view. In Kinescope’s analytics, a view counts after five seconds of continuous playback. Refreshing the page adds another load, even if the visitor is the same person. Kinescope’s unique impressions also use device sessions, so that metric should not be presented as a verified headcount.
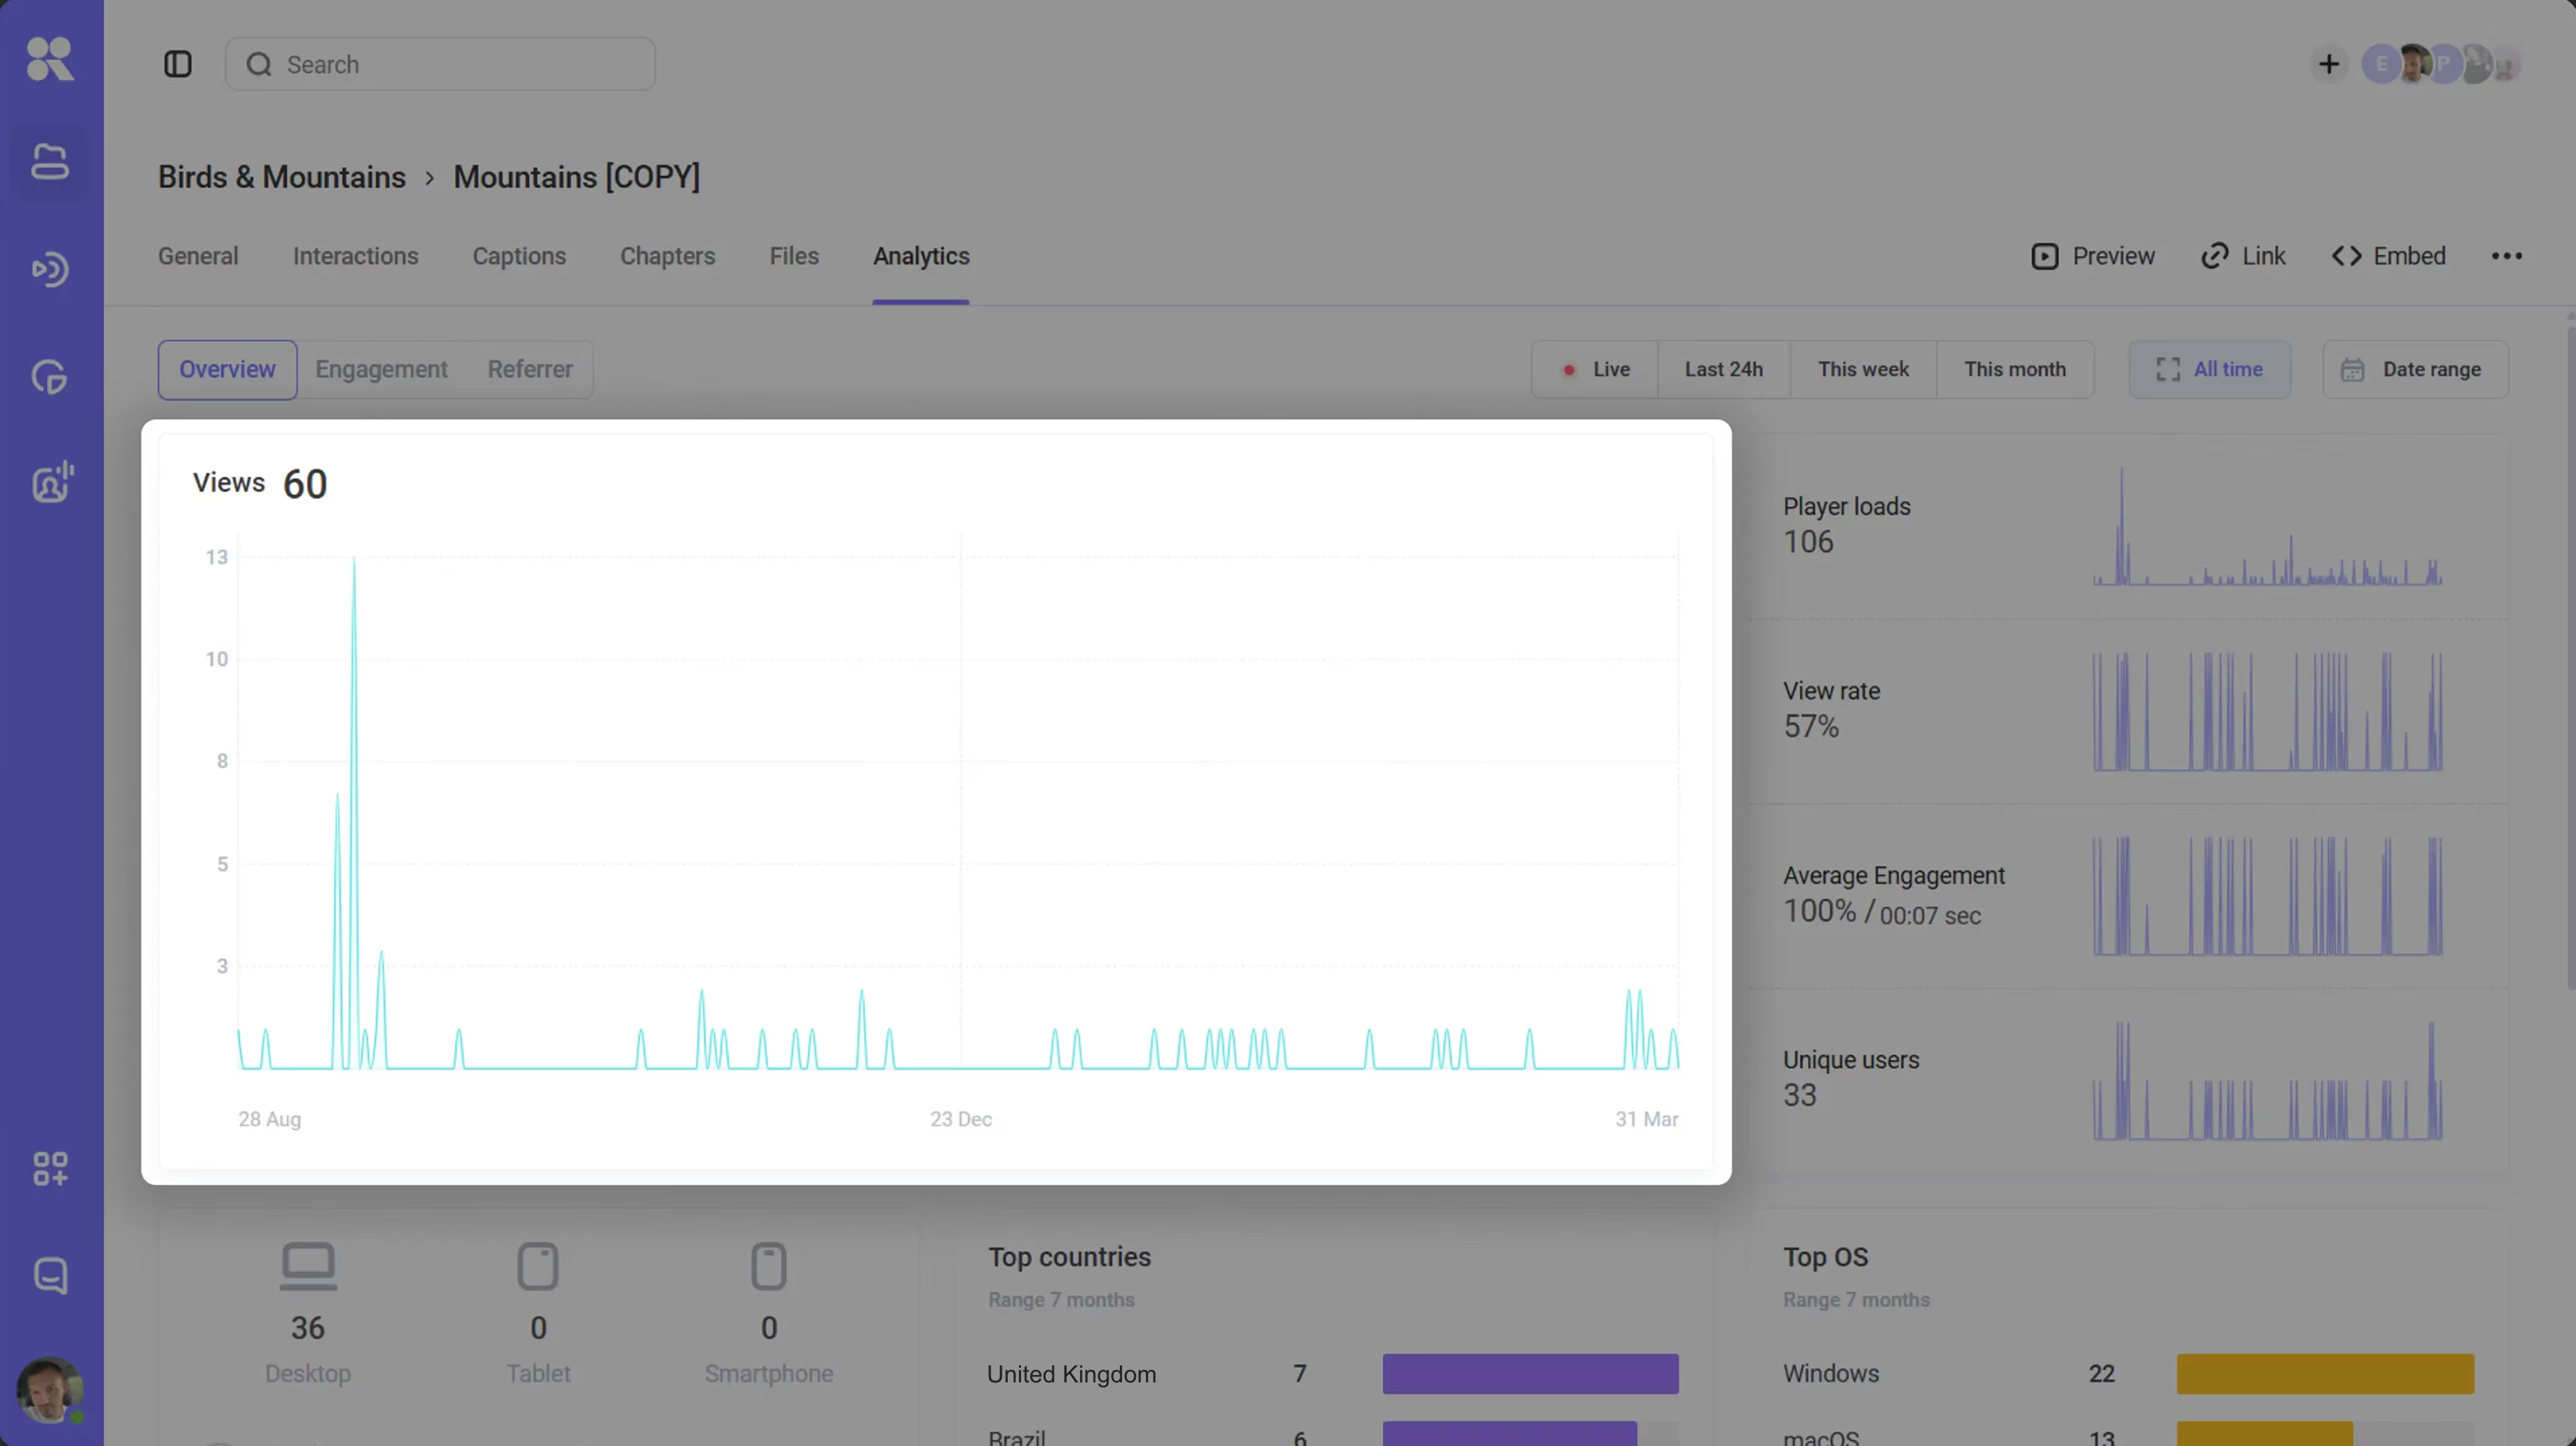
Kinescope’s referrer report groups viewing data by the page where the player is embedded. Its view rate is views divided by player loads, multiplied by 100. Thus, 200 views from 1,000 loads give a 20% view rate. The calculation describes recorded loads and views, so identifying the share of individual visitors who watched requires visitor-level tracking.
What counts as a view depends on the platform, video format and metric being reported. Even within YouTube, organic Shorts in the regular feed and skippable ads shown before or during another video follow different counting rules.
| Platform, format and metric | What counts |
|---|---|
| Kinescope hosted video — views | Five seconds of continuous playback |
| Vimeo player — views | Playback of any part of the video, regardless of watch duration |
| Wistia video — plays | Interaction with the player, such as clicking play, unmuting or scrubbing; autoplay alone does not count |
| YouTube Shorts — organic views | A start or replay, with no minimum watch time |
| Skippable YouTube ads — TrueView views | Thirty seconds of watching, the end of a shorter ad, or a qualifying click |
How to read a retention curve
A retention curve plots viewing against time in the video. If the curve uses percentages, check what they are calculated from and how repeat plays are represented. For example, Vimeo calculates its retention percentage relative to total views, while Wistia’s engagement graph displays replays above the main viewing layer. A peak must therefore be read using the rules of that particular graph.
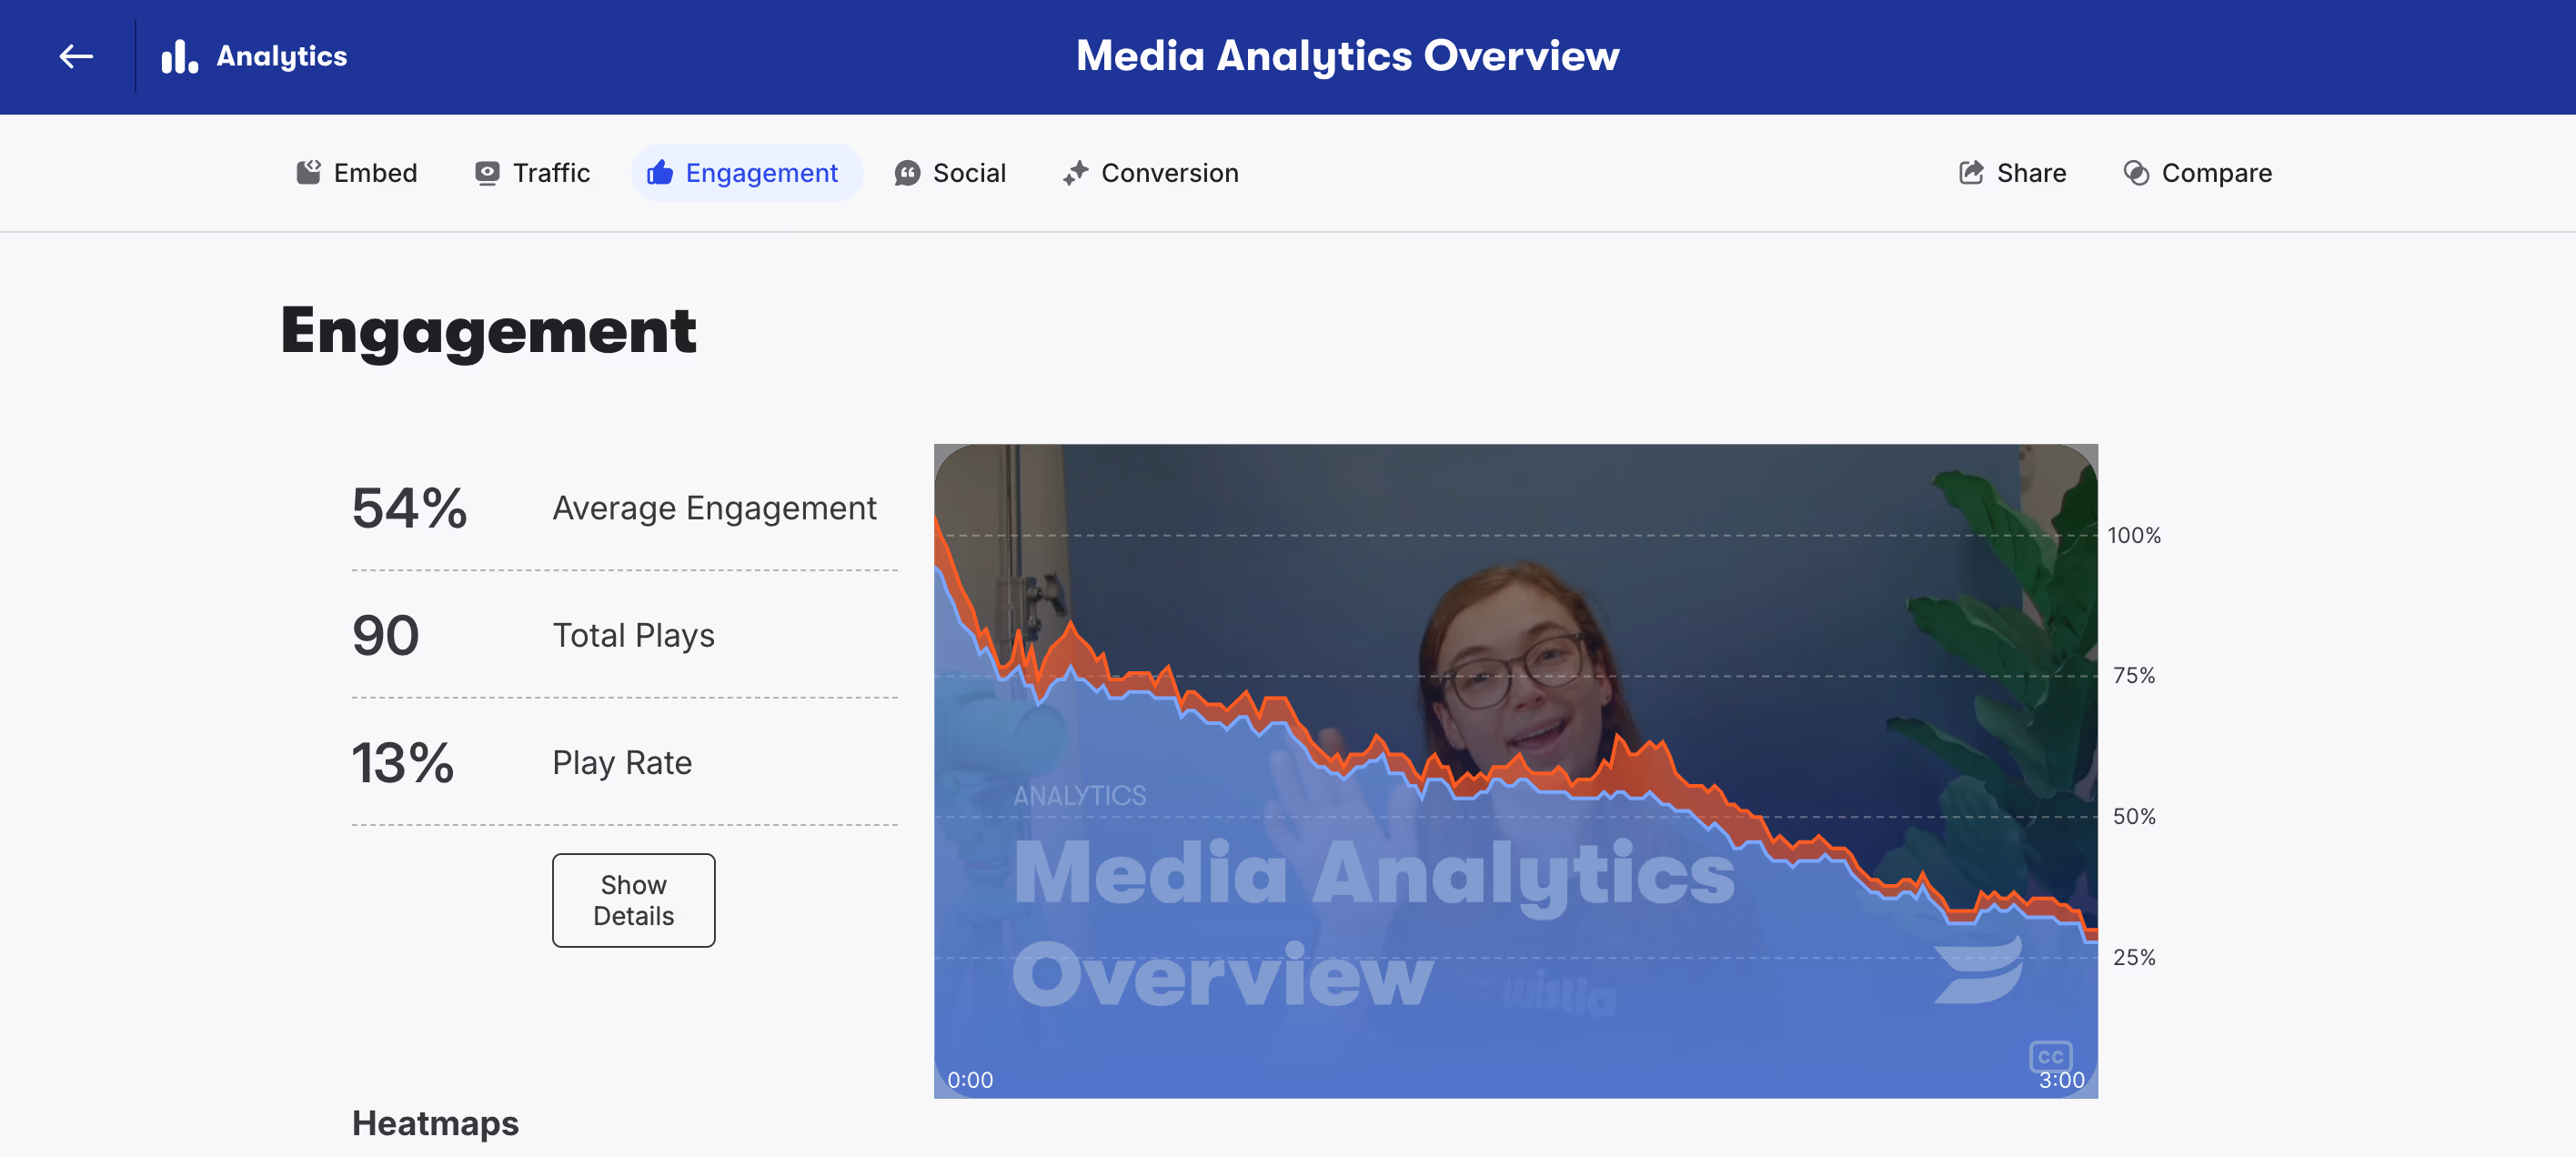
YouTube’s guidance explains that dips can reflect skipped sections or stopped viewing. Consequently, subtracting two points on an aggregate curve does not necessarily count people who left: skips, repeat plays and starts midway through a video can change the audience represented at each point. Where session details are available, check whether viewers resume later in the video before deciding to move or cut the skipped section.
When does a drop suggest the video needs an edit?
A drop before an essential explanation is worth investigating when it appears repeatedly among viewers watching under similar conditions. Watch that passage: a long introduction, an unclear transition or an outdated instruction may help explain the pattern. With only a few viewing sessions, however, individual exits can produce a large-looking drop.
If the decline occurs only in one browser, check playback there first. If viewers leave after reaching the answer they needed, the video may already have served its purpose. An edit needs to address a plausible problem at that point in the video.
What to measure for sales, learning, marketing and support
Once the counting rules are clear, the next choice is what successful viewing should lead to. A person leaving before the end may have missed the essential explanation or already found the answer. The video’s job determines which possibility to investigate.
Sales: connect the demonstration to the next conversation
Track retention up to the demonstration that addresses the buying decision, drop-off during that passage and subsequent meeting bookings. A dip before the demonstration suggests reviewing the lead-in, while a dip within it gives you a passage to inspect for clarity and relevance.
To determine whether prospects who played the demonstration later booked a meeting, link their individual viewing records to the CRM, as described below. You can then measure the share of identified viewers who book within a defined follow-up period. A higher booking rate among viewers may also reflect stronger initial interest, so it does not by itself prove that the video increased conversions.
Learning: measure coverage and understanding separately
In training, retention through essential explanations, drop-off before required steps, repeat viewing and completion rate help locate material that needs review.
A replay peak around an explanation becomes more informative when paired with assessment results: learners may be using it as a reference, or returning because they have not understood it. If they repeatedly watch that passage and still struggle with the related task, review the explanation and assessment together.
Completion rate helps track progress through the lesson, while assessment results show whether learners can apply what was taught. If completion is meant to confirm that all required material was watched, calculate completion from the passages played rather than arrival at the final frame.
When choosing video hosting for education, check whether it provides timeline reports or lets your learning system build them from playback events. Our course-hosting comparison covers the broader platform choice.
Marketing: follow the audience from arrival to response
A campaign aimed at enquiries needs three measures: view rate, retention up to the offer and page conversion rate — visits with a submitted form divided by all tracked visits to the campaign page, including visits where the video was never started.
These measures describe successive parts of the visit. A low view rate makes placement and the poster candidates for a test; a decline after playback begins points to a section of the video. Strong retention can still describe a small minority of page visitors, however. The share of all visits that included viewing of the offer establishes how much opportunity the video had to contribute to enquiries.
When many visitors play the offer but few of them submit, the offer and form experience become plausible places to investigate. Here, conversion is measured within one visit, with offer viewing and submission linked to that visit. A later submission belongs to a different analysis, using returning-visitor identification and a defined follow-up period. Breaking the sequence down by traffic source can reveal whether a campaign’s audience accounts for the pattern.
An awareness campaign has a different endpoint. Audience reach, under the platform’s unique-viewer definition, and retention through the core message describe how widely the video played and how far viewing continued. Audience research is needed to establish whether people remember the message afterward.
Support: look for resolution after the relevant step
Track whether viewers reach the step that solves the problem and whether they replay it. Read the engagement curve alongside task completion: someone who leaves after the fix and completes the task has achieved the intended outcome, even if they never reach the video’s ending.
Repeated viewing becomes a reason to investigate when the viewer still cannot complete the task or contacts support about the same issue. Review that passage for missing steps or differences from the current interface. If task completion cannot be tracked, ask viewers whether the video solved their problem.
The same focus on a completed product action can guide onboarding videos, where the next step in the product matters more than reaching the end of the video.
How to connect video engagement analytics to your CRM
A CRM can place video playback in the history of a sales conversation. An entry recording which section played, and when, gives the salesperson something to clarify with the prospect; its timestamp also allows an analyst to establish whether playback preceded an enquiry or meeting booking.
In Kinescope’s Analytics tab, ready-made reports include loads, views, average watch depth and breakdowns by placement source and device. The documented watch-depth metric counts repeated viewing of the same section within a session once, so it cannot reveal how often that section was replayed.
For repeat counts, individual viewing paths or coverage of a chosen section, the IFrame Player API provides playback events and positions for custom calculations. Code added to the website containing the player collects these events and calculates which sections played during each viewing session. Sending that playback history to a CRM contact requires an integration with the video player.
The integration has four steps:
- Define the viewing milestone. Choose the section that matters for follow-up and how much of it must play. If the rule concerns coverage, replaying the same few seconds adds no new material.
- Build the viewing record. Combine the intervals played, accounting for pauses, jumps and playback speed. Retain the video ID and version, session identifier and event times so the record remains tied to the content that played, even after an edit.
- Match the record to a contact. Use a known identifier, such as a logged-in user ID mapped to a CRM contact. Without that link, the viewing record cannot reliably be assigned to the person.
- Send the milestone and its time. Once the playback rule is met, add the activity to the contact history, keeping detailed playback in analytics. Prevent retries from creating duplicate entries, and decide whether a later viewing should appear separately for follow-up.
Before contacting a prospect, a salesperson can review the recorded playback and choose what to ask about. The record shows which sections played, but cannot establish whether the prospect understood them. If no playback is recorded, the prospect may still have watched without being identified.
From a viewing pattern to a useful change
Video engagement analytics is most useful when it helps explain a specific result. In a lesson, viewing records and assessment results can help locate an explanation learners struggle with. On a campaign page, starts and viewing through the offer help show where visitors stop progressing toward an enquiry. Together, these observations give the team a reason to change a particular part of the experience and a way to evaluate the result.
Explore Kinescope’s video analytics to review viewing patterns and connect playback data with the outcomes that matter to your team.